Data and Probability Games for Grades 2‑8
Data and probability help students make sense of the information around them. In these games players collect tallies, build bar graphs and line plots, find the mean and median and see how an outlier pulls them around, and run spinners to compare what should happen with what does happen. The habit to build is asking what a set of numbers is really saying. The games are short, work on a Chromebook or a phone, and give instant feedback on every answer.
6 free games on this page, for grades 2-8. Each opens its own page with controls, standards and teacher notes.
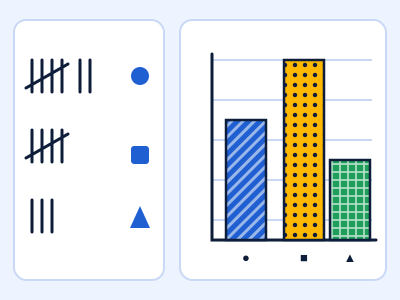
Critter Survey
Count the tally marks, build the bar graph, then answer questions about it.
Grades 2-5 6 min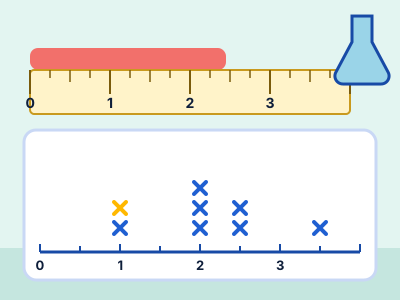
Line Plot Lab
Measure lab specimens to the nearest fraction and plot every one.
Grades 3-6 6 min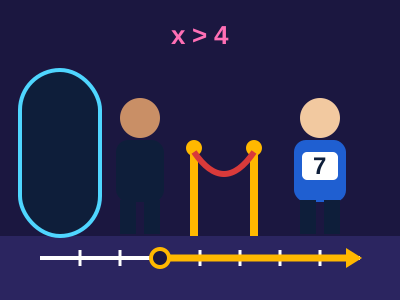
Inequality Bouncer
Work the velvet rope: admit only the guests whose numbers fit the rule.
Grades 6-8 6 min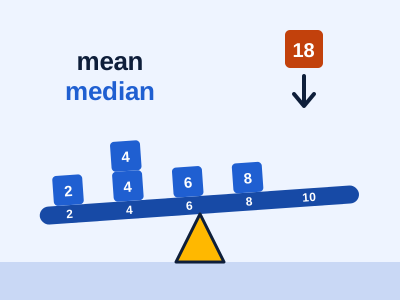
Mean & Median Balance
Slide the pivot to the balance point, then see what an outlier does.
Grades 6-7 6 min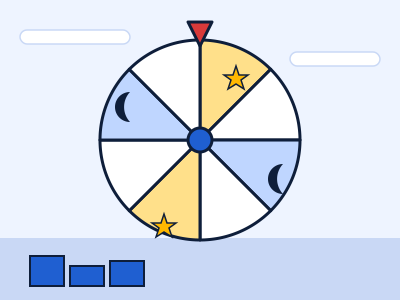
Spinner Workshop
Build toy and board-game spinners that hit an exact chance, then test them.
Grades 7-8 6 min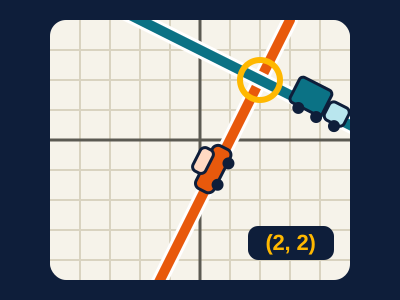
Systems Crossroads
Steer two vehicles to the one point where their roads cross.
Grade 8 6 minStandards covered
2.MD.D.10, 3.MD.B.3, 4.MD.B.4, 5.MD.B.2, 6.EE.B.8, 7.EE.B.4.b, 6.SP.B.5, 6.SP.A.3, 7.SP.C.5, 7.SP.C.7, 8.EE.C.8.A, 8.EE.C.8.B, 8.EE.C.8.C